🇺🇸 English· 🇲🇽 Ver en Español
← All features 📅 Scheduling & Dispatch 📋 Quotes & Estimates 🧾 Invoicing 💳 Flusso Pay 👥 Client Management 🔄 Service Plans ✍️ Contracts & E-Sign 📦 Inventory 💰 Commissions ✅ Tasks 🧑‍🔧 Team Management 📊 Analytics 📈 Job Profitability 🤖 Opi AI Assistant Pricing
Log in Get started →
📊 Analytics

Stop guessing.
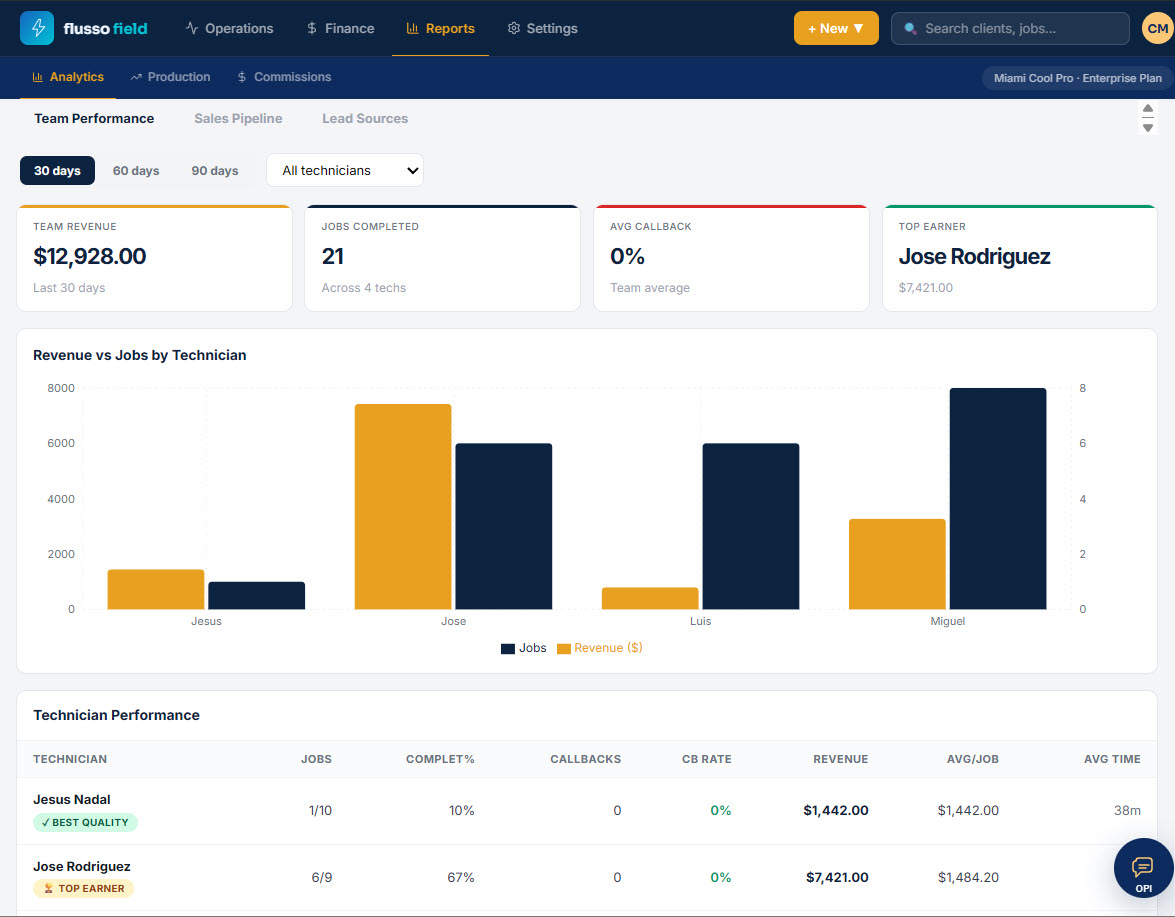
See how you're really doing.

One Reports screen turns your jobs into answers — revenue trends, jobs completed, and how each technician is performing. Spot your top earner and your callback rate at a glance instead of running the numbers in your head. Starting at $27.97/mo.

Included in all plans Team & job performance Works on mobile
app.flussofield.com/reports
Analytics screen
At a glance
Team revenue, jobs done
and top earner up top
By tech
Revenue, completion %
and callback rate per person
30 / 60 / 90
Switch the window and
the whole report updates
Team Performance

The numbers that matter,
right up top.

Open Reports and the headline metrics are already there — team revenue, jobs completed, average callback rate, and who your top earner is. Pick 30, 60 or 90 days, filter to one technician or the whole crew, and the whole dashboard recalculates.

  • Team revenue, jobs completed and average callback up front
  • Top earner highlighted automatically
  • Toggle 30 / 60 / 90-day windows in one tap
  • Filter to a single technician or the full team
Team performance · last 30 days
TEAM REVENUE
$12,928
Last 30 days
JOBS COMPLETED
21
Across 4 techs
AVG CALLBACK
0%
Team average
TOP EARNER
Jose Rodriguez
$7,421
Technician Breakdown

See who's pulling
their weight.

The Technician Performance table puts every tech side by side — jobs, completion rate, callbacks, revenue, average per job and average time on site. Best Quality and Top Earner badges surface your standouts without you crunching anything.

  • Jobs, completion %, callbacks and callback rate per tech
  • Revenue, average per job and average time on site
  • Best Quality and Top Earner badges applied automatically
  • Sort and compare the whole crew in one table
Technician performance
Jesus Nadal
✓ Best quality · 10% complete
$1,442
1/10 jobs
Jose Rodriguez
★ Top earner · 67% complete
$7,421
6/9 jobs
Luis Garcia
0% callback rate
$2,610
3 jobs
Reports & Trends

Revenue vs jobs,
one chart.

The Revenue vs Jobs chart plots what each tech billed against how many jobs they ran, so effort and output line up next to each other. Flip between Team Performance, Sales Pipeline and Lead Sources to answer the question you actually have.

  • Revenue vs Jobs by technician on one bar chart
  • Team Performance, Sales Pipeline and Lead Sources views
  • See where the work — and the money — is really coming from
  • Reports live under one tab, no extra dashboard tool
Report views
1 Team Performance — revenue & jobs by tech
2 Sales Pipeline — what's quoted vs won
3 Lead Sources — where jobs come from
Know what's working at a glance
Analytics

Stop guessing.
Start knowing.

Included in every plan. Revenue trends, team and job performance from day one. 30-day money-back guarantee — no questions asked.

Get started — from $27.97/mo → See pricing
30-day money-back Cancel anytime No contracts